")
")
")
")
")
Executive Summary
A gap still separates requirements and results of business intelligence (BI) implementations. This BI gap exists primarily because warehouse-centric technology is the only technology being applied to BI initiatives. Consequently, the value and applicability of current BI solutions is unnaturally constrained by the underlying warehouse technology and techniques used. This means that a majority of business requirements for BI go unsolved or underserved.
The right approach to filling the BI gap is to complement the warehouse toolset with agent-based technolo- gy. This software is specifically designed to reach across the layers of the BI environment, essentially covering the enterprise in a Grid or fabric of agents. Each agent is capable of monitoring, collecting, and analyzing data and events from virtually any object in the environment. Moreover, a composite or correlated view can be created from a predefined set of data or events, affording true BI that can facilitate the decision-making process.
It is our command of the organization’s infrastructure that determines the delivery and success of BI. Therefore, the front-line of BI is found in IT, where leadership exists for the creation of a BI fabric in the form of IT management software and its related technology.
Established implementation processes will facilitate the adoption of the BI fabric where the broader corporate community will first accept agent-based networks. Initial tasks will include the movement of data.
Why do executives still lack consistent, reliable access to information, even as the technology for BI applications advances and the techniques mature? It seems that our vision of BI — enterprise- wide decision-support solutions — continues to outdistance our ability to realize this vision. It seems that BI remains an illusion for most organizations.
One would think that as our technology improves, so should our ability to gather, synthesize, internalize, and exploit the data streaming into our organizations. But that is not the case for most companies. Of course, there are plenty of excuses offered. Some argue that the volume of data pouring into organizations hamper BI initiatives, and the Internet exacerbates the problem. Another challenge that many consider a source of pain is the complexity of data integration required in today’s global enterprise. And third, there are those who contend that the difference between available technology and our inability to deliver ideal BI solutions is created by users’ insatiable appetite for information.


While each of the arguments might be true, they still don’t account for the gap between the tools and techniques currently available, and the analytical solutions being delivered. It simply is not acceptable to say that BI is unachievable because there is too much data, it requires complex integration, and/or users are never satisfied.
The purpose of BI initiatives is to take that unwieldy, dynamic, enterprise-wide data and turn it into a predictable stream of decision-support content that addresses the requirements of our user communities. But, in fact, our ability to exploit the massive amounts of data our organizations generate is not resolved by the traditional technology we introduce or common techniques we attempt to implement. Worse still, it appears that as companies add more technology, the more fragmented information becomes.
Whether applications are packaged or homegrown, they are often mission-critical by themselves – employing disparate databases, and forming interdependencies. Moreover, most Internet-based business transacts across uncontrolled environments and beyond the corporate boundaries. Couple all of this with real-time, straight-through processing, and Web services. Complexity on this scale is difficult to comprehend, much less control.
So, is the problem created by the technology, our inability to correctly implement and utilize the technology, or both?
This paper starts by describing why there is a gap between, on the one hand, the typical technology and techniques used in BI efforts and, on the other hand, the ability to deliver meaningful analytical applications. The document then defines and describes the various layers of BI and how those layers blend together to provide the necessary information for business analysis. The paper concludes by proposing a BI fabric be extended across the enterprise using a Grid of agent-based technology as a solution for many BI initiatives.
So why is there a gap between the promise of BI and what is typically delivered to user communities? This question is easily answered by examining how BI initiatives are planned and conducted. Contemporary thought squarely focuses BI on a foundation of data warehouse technology and techniques. In other words, many BI initiatives offer little more than warehouse- centric solutions.
Data warehousing – periodically gathering disparate data, cleansing and integrating that data, and then loading it into static, persistent data structures – is vital. This process, when implemented correctly, provides a single version of the true picture across the enterprise as well as the basis for strategic analysis. For that reason, the warehouse architecture serves a critical role in BI environments.
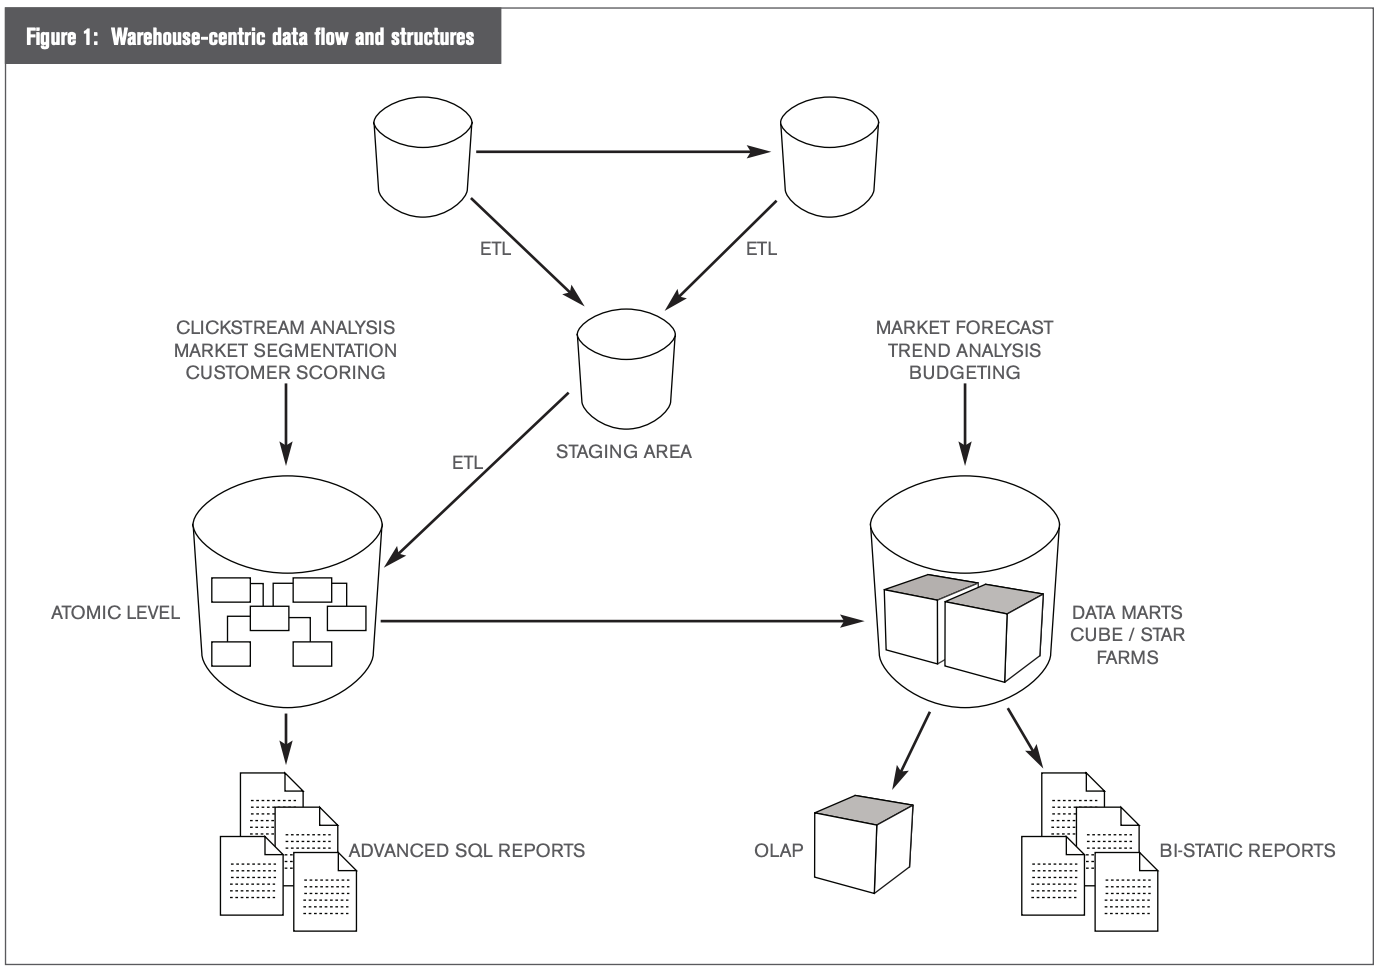
But the value of warehouse-centric implementations is also its limitation. As Figure 1 illustrates, a data flow is established from operational sources to a staging area, then to the atomic-level warehouse, and finally to data marts. The rationale for this conscious propagation of data is to ensure data quality, historical integrity, and completeness of record — all of which are critical for strategic analysis.
Moreover, each physical data structure is specifically designed and implemented for a particular function. For example, the atomic layer of the warehouse is typically implemented to establish historical integrity and maintain the lowest level of data granularity across all subject areas of the warehouse environment. The data marts, conversely, are designed to serve up dimensional data for a particular subject area. This type of data structure is commonly used for on-line analytical processing (OLAP).
Once each data structure is designed and data flow from physical structure to physical structure is initiated, a timeframe is established, a batch window in which this propagation occurs. It is also necessary to dictate the type of technology necessary to implement the process. The data structures, therefore, constrain the types of BI applications possible and, consequently, create a gap between what can be delivered and the needs of the user communities.
Data warehouse applications provide an important source of strategic data. They are commonly used for prediction, forecasting, and trend analysis. But while BI includes strategic analysis, it by no means is limited to that type of application. BI must also offer solutions for zero-latency analysis, business activity monitoring (BAM), business rule inference, reporting key performance indicators (KPI), and even some straightforward, tactical reporting.
Limiting the enterprise’s BI efforts to the established standards of warehouse-centric technology and techniques, however, guarantees that an organization will never be able to effectively address all of its BI requirements. And, in fact, many warehouse efforts fail to deliver on the BI promise. At least 50 percent of BI projects will not reach their full potential or will be dismal failures during 2003. Project planners and BI architects who insist on overlooking the fact that there are multiple layers that form the BI fabric of their organizations, risk being part of this failure rate.
Before we discuss how to close the BI gap, we must first examine the framework on which BI is based. There are at least five fundamental and distinct BI layers in any large organization. Each is composed of many objects. Every one of the layers affords a unique perspective and is a source of exclusive information. These layers should work as a cohesive whole. Unfortunately for many organizations, however, they often do not.
At this point, it is important to note that this paper concentrates on the objects contained at each layer and the layers themselves, and thus sets aside discussion of the data, information, or value that is within each object. Of course, any BI requirement will certainly seek out the value of the object itself. Nevertheless, the BI effort must first move through the lattice of BI layers and objects to gain access to the value sought. It is the network of these objects that is the focus of this paper.
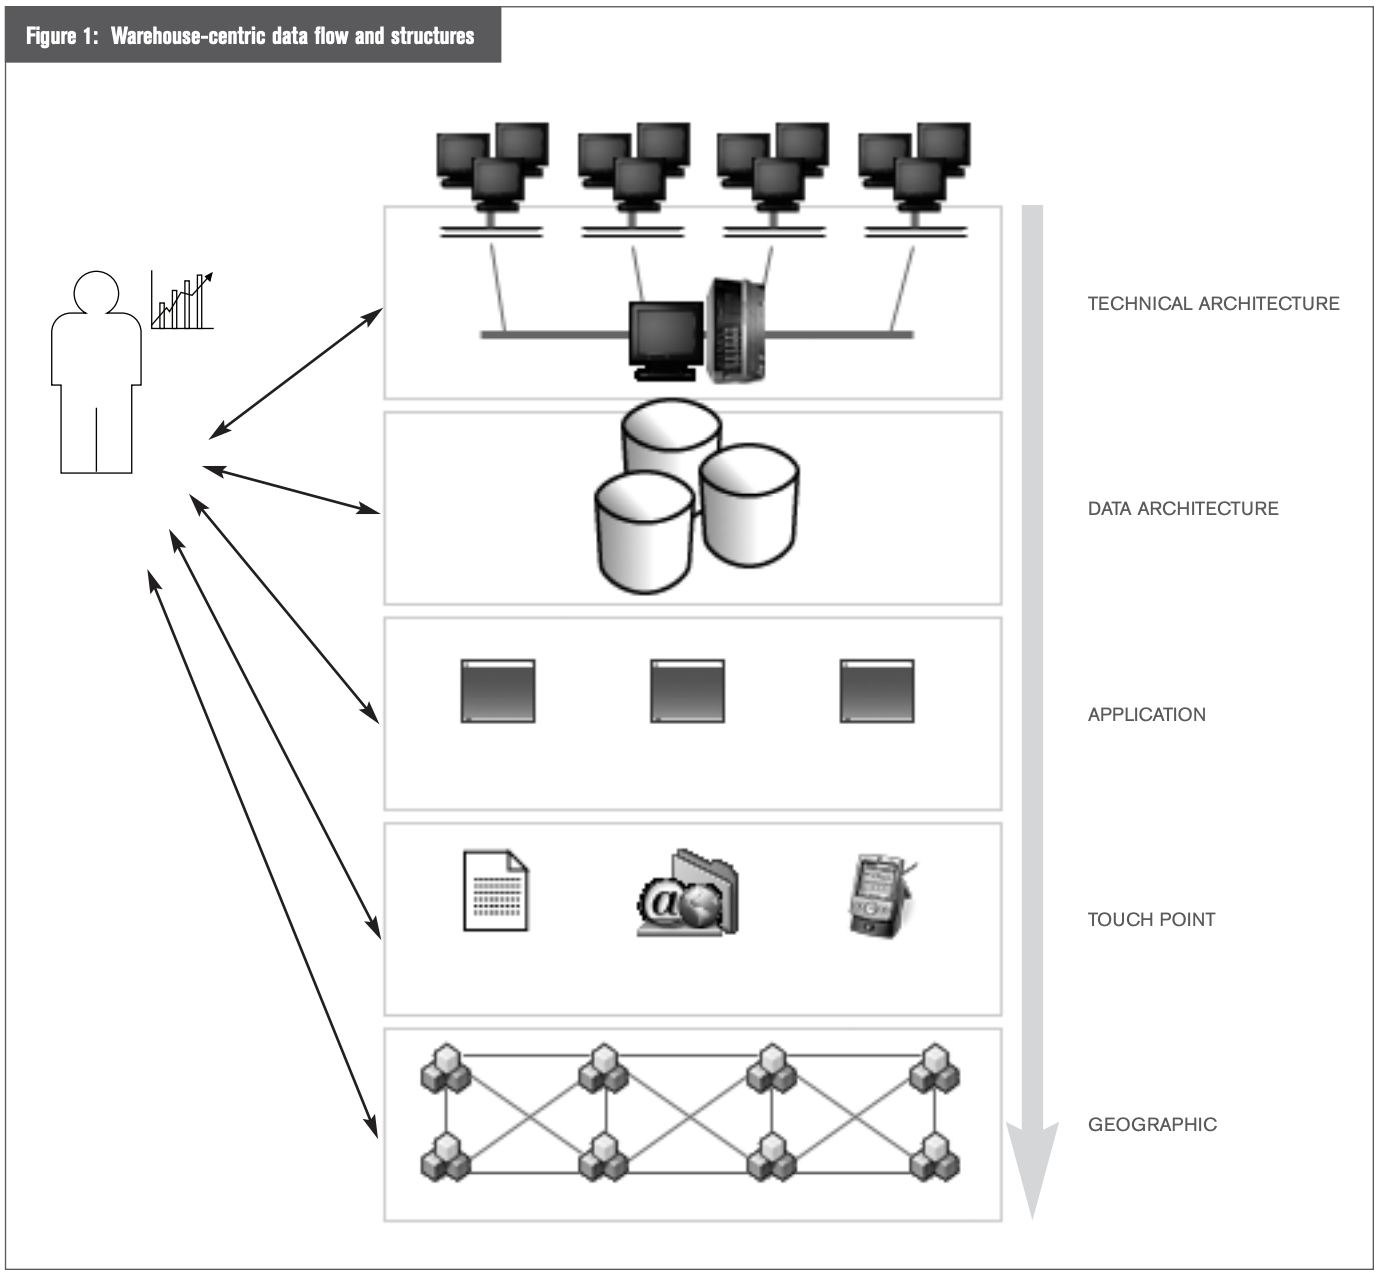
Figure 2 (page 5) illustrates the five fundamental layers that BI project planners and architects must consciously consider. One challenge of BI initiatives is to navigate across the breadth of the enterprise, traversing the necessary layers, while monitoring, collecting, or otherwise interacting with specific objects at each layer.
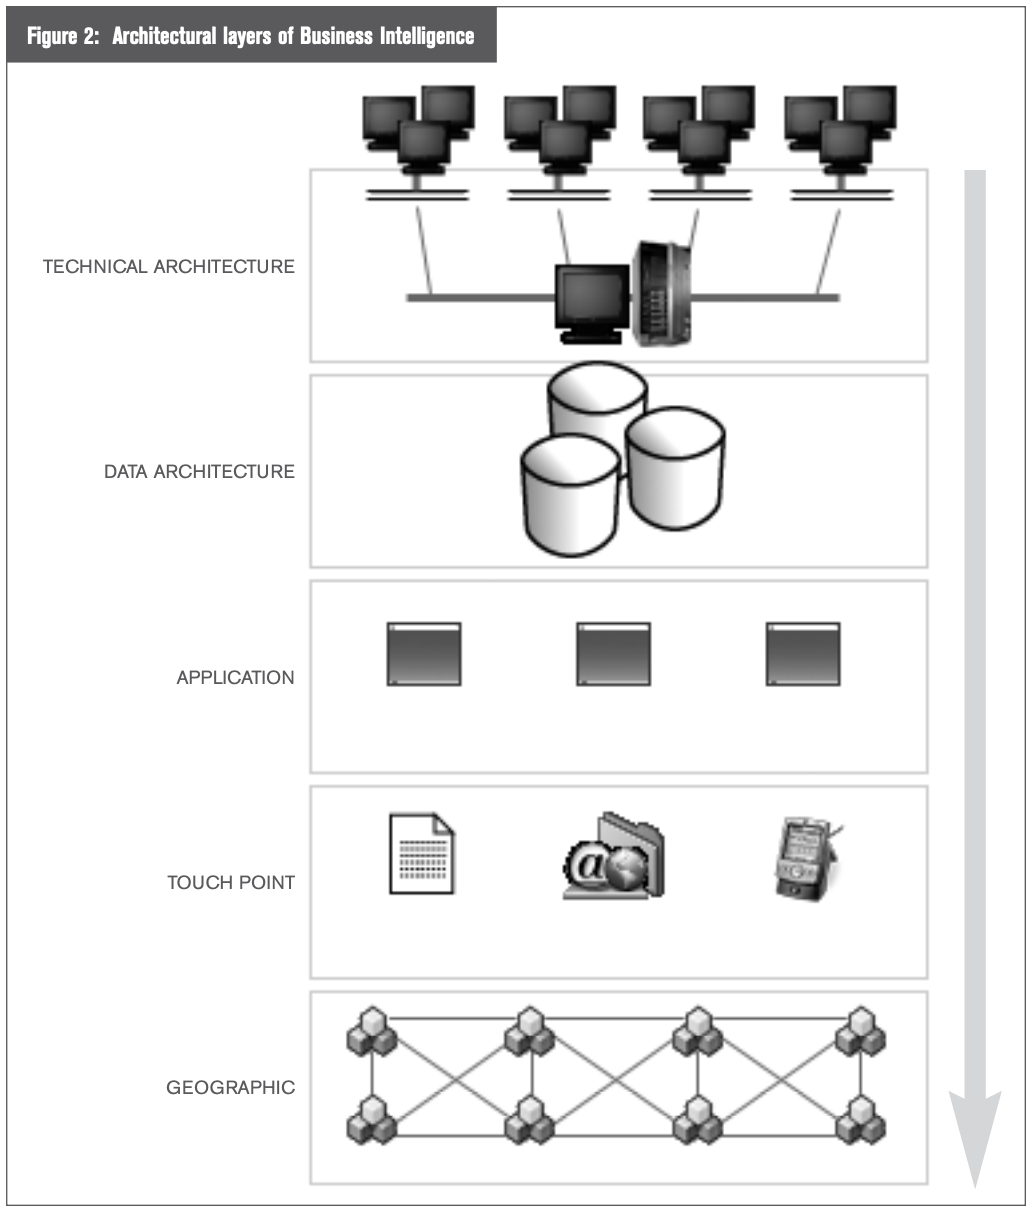
Table 1 (page 6) describes the BI layers and provides some sample objects representative of the layer, offering a sense of the scope and reach of BI. Refer to Appendix A for more information regarding each BI layer.
Many user communities spend their entire analytical life focused on the informational insight found by combining a few specific objects of only one or two particular layers. For instance, the budget and forecast officer may be concerned about only the OLAP tool that performs his what-if analysis (application layer) and the cube that contains the data being analyzed (data layer). The work this office performs, however, may be invaluable to the organization. Nevertheless, the work is based on a rather straightforward BI requirement: essentially two objects, one residing on the data layer and the other on the application layer. The only possible complexity is sourcing the general ledger data to build the cube, if it is not already centralized.
Another complex example can be found in IT management. What if the CIO is charged with the task of determining why the system slows down, potentially losing millions of dollars if stock traders cannot fill orders? At first glance, the organization might think this BI effort is only a technical architecture issue. But, in fact, IT will need to go much further to provide a true picture of resource usage. They will need to gather information from application licenses and the number of users actually using the applications at any given time. Moreover, touch points must be examined to ensure IT understands how this system’s usage is being distributed throughout the organization. And, finally, geography may play a role in creating the final, composite image.
Why would IT go through this effort? Too often, IT lacks the necessary BI insight, which forces big ticket purchases. For example, if IT only knows that the overall system performance for its stock traders is poor during peak time, management may authorize the purchase of $10 million worth of extra equipment to address the performance issue. Problem solved. Technically, there is no longer a performance issue because the company just threw more hardware at the problem. But there was. never any insight into why the problem existed in the first place — which could lead to more efficient and effective solutions. Perhaps, with better insight, IT could determine that performance problems are confined to the Denver branches because Denver traders have instructed local IT to run extra programs. Ultimately, these rogue programs compromise the entire system’s performance. So instead of buying more equipment, with BI insight, IT management can implement a more efficient and effective solution.
Executives understand that, irrespective of their core business, they must make decisions that directly influence results. They realize that any business effectively exploiting information for better decision-making will have the greatest competitive edge.
Powerful transaction-oriented information systems are now commonplace in every major industry, effectively leveling the playing field for corporations around the world. But the data generated in these systems is not the only informational insight available to the modern executive. Resident at each architectural layer is a wealth of data that can supplement specific BI research, as well as expand the overall analytical landscape available to the organization.
To remain competitive requires analytically oriented systems, actively traversing all BI layers, revolutionizing a company’s ability to rediscover and exploit information they already own. These BI applications derive insight from the wealth of data available and the knowledge pool of their most skilled employees — delivering information that is conclusive, fact-based, and actionable.
Operational systems generate vast quantities of product, customer, and market data from point-of- sale, reservations, customer service, and IT technical support systems. The challenge is to extract and exploit this information. Unfortunately, many companies take advantage of only a small fraction of their data. The remaining untapped data is a gold mine waiting to be explored, refined, and shaped into informational content for the organization.
Armed with this knowledge on a timely basis, companies can dynamically interact on a personal level with vendors, suppliers, and customers through call centers, IT help desks, kiosks, billing statements, the Internet, and other touch points that facilitate genuine, one-to-one customer relations management on an unprecedented scale.
By design, traditional warehouse-centric technologies and techniques cannot readily afford the flexibility necessary to address many BI requirements. Business intelligence solutions must therefore evolve beyond the implementation of traditional data structures, such as normalized atomic-level data and star/cube farms. BI cannot be tied to a particular architectural layer; nor can it be dependent exclusively on preprocessed data propagation.
What is now needed to remain competitive is a fusion of traditional and advanced technologies that, together, support a broad analytical landscape, naturally serving up a rich blend of real-time and historical analytics. Business intelligence must lie over the enterprise, like a fabric, covering all the relevant information sources and critical touch points. Figure 3 illustrates a cohesive network of agent-based technology that monitors, collects, analyzes, notifies, and proactively reacts to the ever-changing landscape of the organization.
This BI fabric is a complement to existing BI structures, techniques, and technologies. The fabric does not replace traditional warehouse structures or warehouse-centric applications. Instead, it facilitates the use of strategic data stored in these structures in several ways.
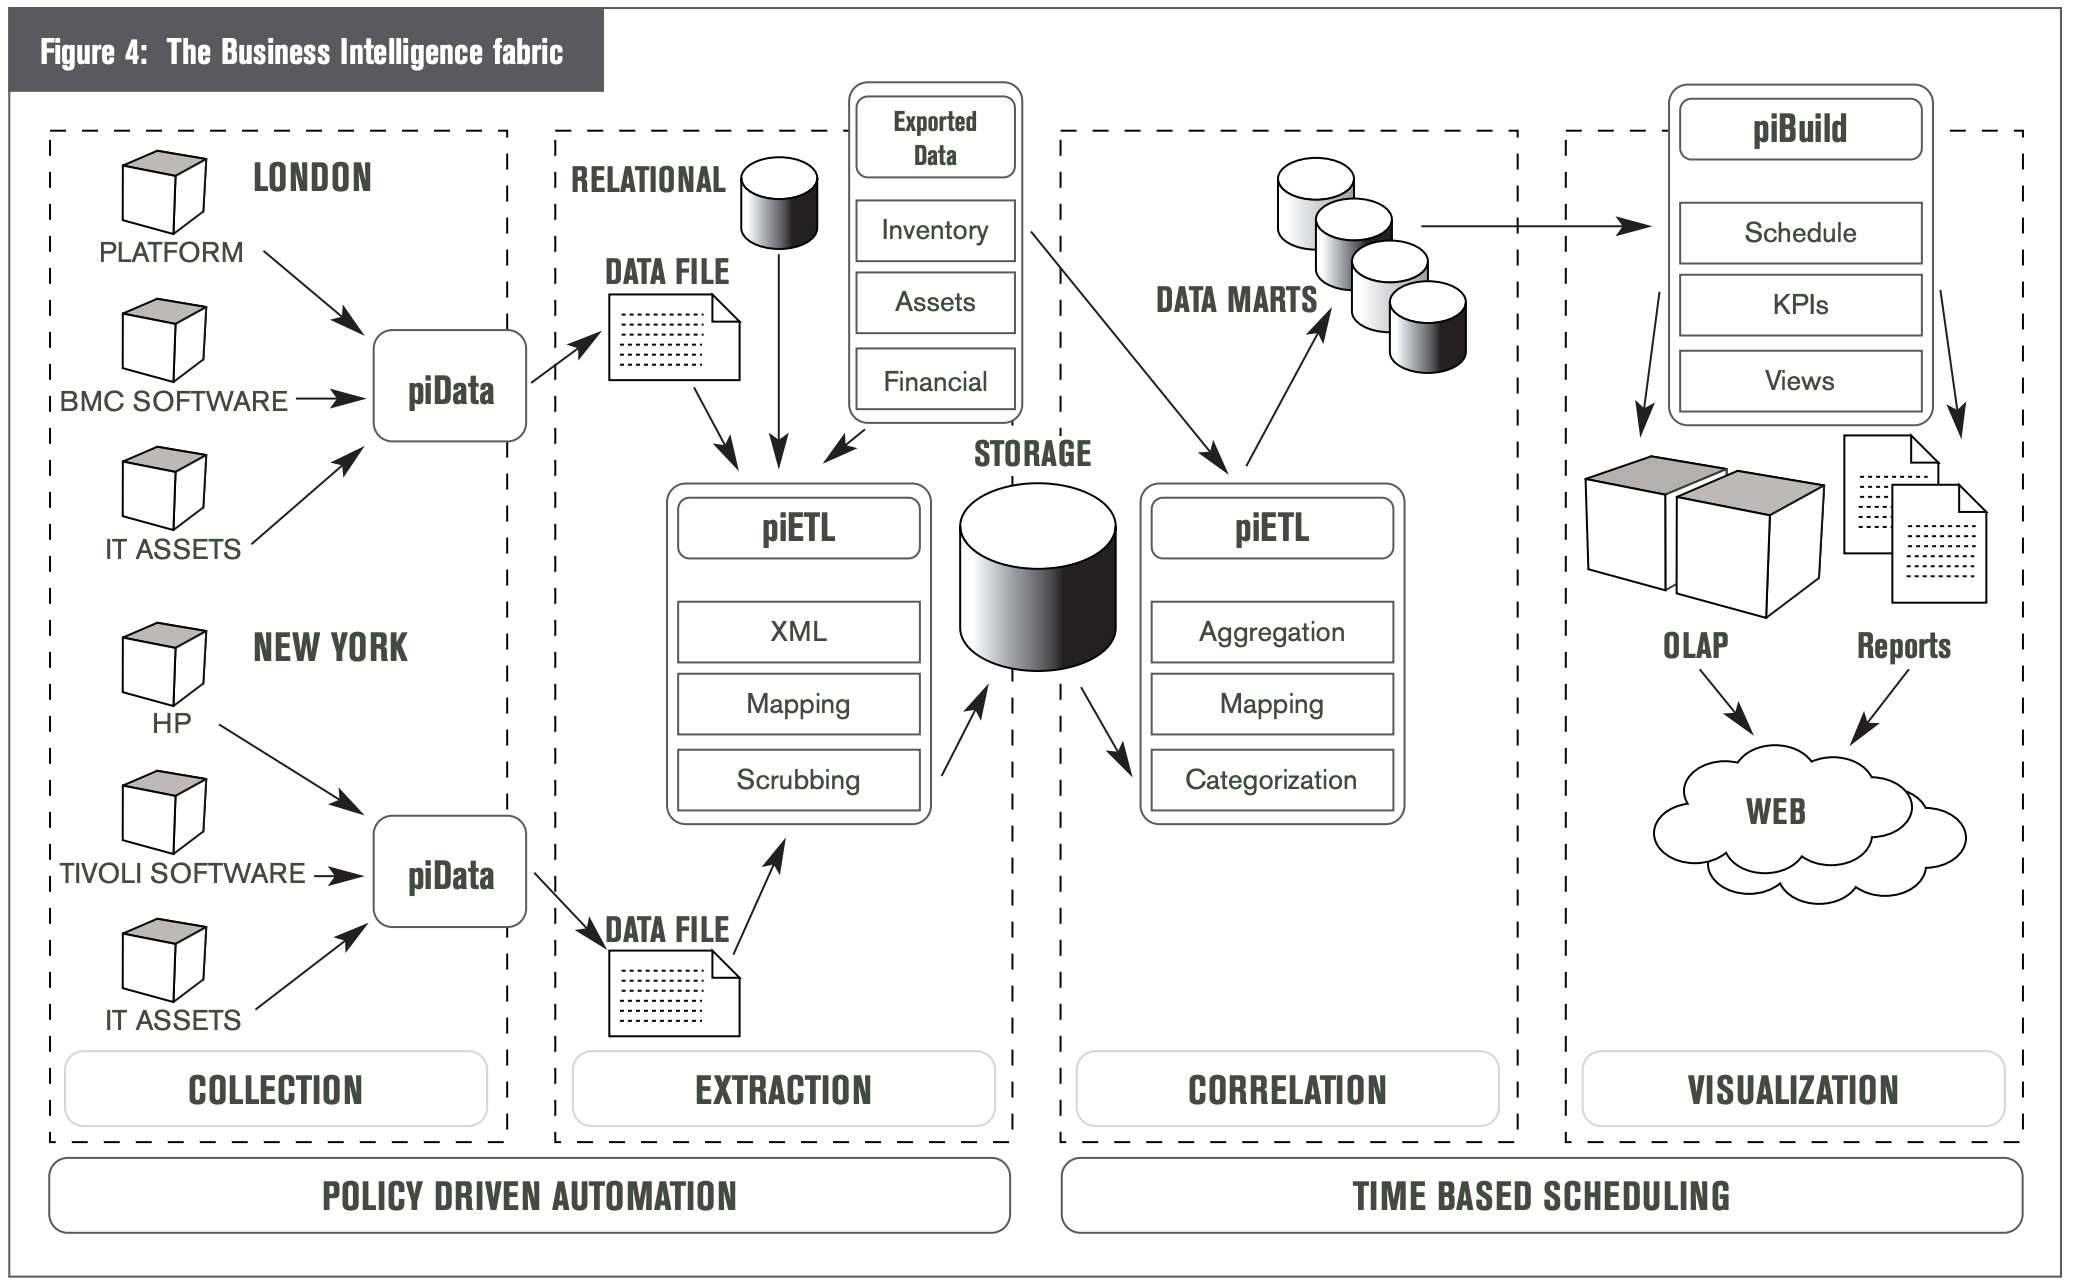
For example, consider an organization that wants its call center operators to know whether each caller is likely to purchase a promotional service and has a current account. This blend of strategic data is normally stored in the warehouse (forecasting potential purchases), and tactical data (balance of an account) is stored in operational systems, epitomizing zero-latency analysis. It is difficult to access and collect both these types of data and deliver them on demand to a call-center operator. However, a network of agent-based technology representing the BI fabric of the organization can readily access and deliver the data required. As illustrated in Figure 4, the BI fabric must provide a means to embrace all the architectural layers of BI, accessing directly the specific object of interest. By 2005, at least 90 percent of large-scale enterprises will have a set of services and tools that provide for explicit process management, including process analysis, execution, monitoring, and administration in their enterprise nervous system.
In addition to reaching any particular object residing on any specific BI layer, the fabric must be able to collect, monitor, or even analyze data and take action — essentially becoming an active participant in the decision-making process. Enterprises that do not recognize and leverage their analytic skills and staff will be unable to meet strategic business objectives. This functionality requires the fabric to provide a means for encapsulating knowledge from the most skilled employees, and to reduce this wisdom into methodical steps to take in a given set of circumstances.
This technology allows organizations to reproduce proven decision steps from the most highly regarded employees and distribute this knowledge wherever necessary. Armed with this technology, an organization can now duplicate the rare, talented resources that the organization has come to depend on. And, given the fact that these limited resources cannot continuously monitor, collect, and analyze data and events from across the enterprise on a 24×7 schedule, the agents may be the only alternative.
To illustrate this point, consider a financial services requirement to link traders with portfolio managers, executing brokers, compliance officers, and back-office staff in real-time. What was once the domain of the mainframe and dumb terminal has evolved into a distributed infrastructure of powerful workstations and compute servers working in concert. What has not changed is the business-critical nature of response time, application availability, and turnaround time for the key processes required to maximize client services and portfolio performance.
The traditional approach to ensure consistent service levels relies on systems management. This approach was built on a foundation of measurement and instrumentation focused directly on the system, the network, or application performance. The information captured by these systems management tools independently has value, however they may not reflect the big picture that forms when multiple system and performance metrics are correlated together. For example, the response time for a trade may be dependent on desktop CPU performance, network bandwidth, application server response, and I/O load on the database together.
Therefore, progressive approaches include implementing event correlation software. Knowing how the infrastructure and business environment interact is crucial. Software that correlates seemingly disconnected events, including the mapping of relationships between networks, systems, applications and business processes, is invaluable.
This type of approach accounts for the line of business (LOB). The LOB’s needs reflect IT-independent activities, blending the holistic view of system and application performance with the key business indicators to form the backdrop for crucial overall decision-making. The true need is to extract the required data identified by the system and performance management tools, and present it alongside business-critical data to the business analyst and IT management together.
Embracing new, more flexible strategies for IT deployments is another example of how complex requirements are being addressed with IT management software solutions. Server consolidation provides an organization with an approach to rationalize the way computing services are offered, reduce the physical footprint, or even merge operations amongst multiple business units. Making these decisions with information tailored to the peak service loads, or by past utilization patterns per operational group, will ensure the correct systems and services are modified.
A typical mandate for consolidation comes through mergers and acquisitions. Providing actionable information about the key IT metrics for the candidate groups, systems, and services can be derived by comparing and contrasting information by business unit, on a local or geographical basis. In order to institute a consolidation program, it is critical to have insight into day-to-day operations to recognize how systems are being used, and establish a baseline for complex applications use. Only through this analysis do real candidates emerge that can be safely consolidated or converted into a shared operation.
The questions that emerge are fairly clear: How do services overlap? Which are replicated? Are servers purchased and provisioned independently? What are the characteristics or shareable operations? Are there geographic dependencies? Departmental dependencies? Is there mixed technology? Are some operations too critical to be shared? Can low-risk groups accept lower service levels to allow for co-location? How does the operational performance of new mergers and acquisitions affect IT? Will the new IT technology be easily integrated into the current IT operations? Can simple realignment lead to larger overall gains in terms of performance and total cost of ownership savings?
While the overall goal may seem simple — to reduce capital expenditures, simplify operations, or reduce the operational cost structures, for example – the difficulties of deploying a good consolidation program may out-weigh the rewards. Consolidation programs are also living projects. The user community must continue to meet its business objectives, continuously following the move to a reduced server and application footprint.
There are, of course, many other examples of agent-based technology being aggressively deployed for IT infrastructure support, including application deployment and profiling, license management, and total cost of infrastructure ownership.
IT management software is leading the way with agent-based technology because it must address these real-world applications — today. This technology, offered by many vendors, is found under the market labels of “IT management” and “network management systems.” However, for the past couple of years, a few leading IT management software vendors, such as IBM and Platform Computing Inc., have begun to expand the role of their IT management software to include warehouse-centric technology and techniques as well as non-IT specific event monitoring, collection, and correlation.
There must be an established and proven methodology for applying any advanced technology to the organization. Employing a BI fabric across the enterprise is no different. The recognized approach involves six steps, which are depicted in Figure 5.0: Definition, Discovery, Data Collection, Filtering, Correlation, and Visualization.
We first need to clearly identify the business metrics required for the analysis. The definition of business questions to be answered provides the context for subsequent activities. For example, determining how to predict capacity requirements based on trading volume data is very different from performing root-cause analysis of a trading application failure. In this phase, we will work with the organization’s team to jointly identify which system metrics, and other related metrics, are required to meet business objectives.
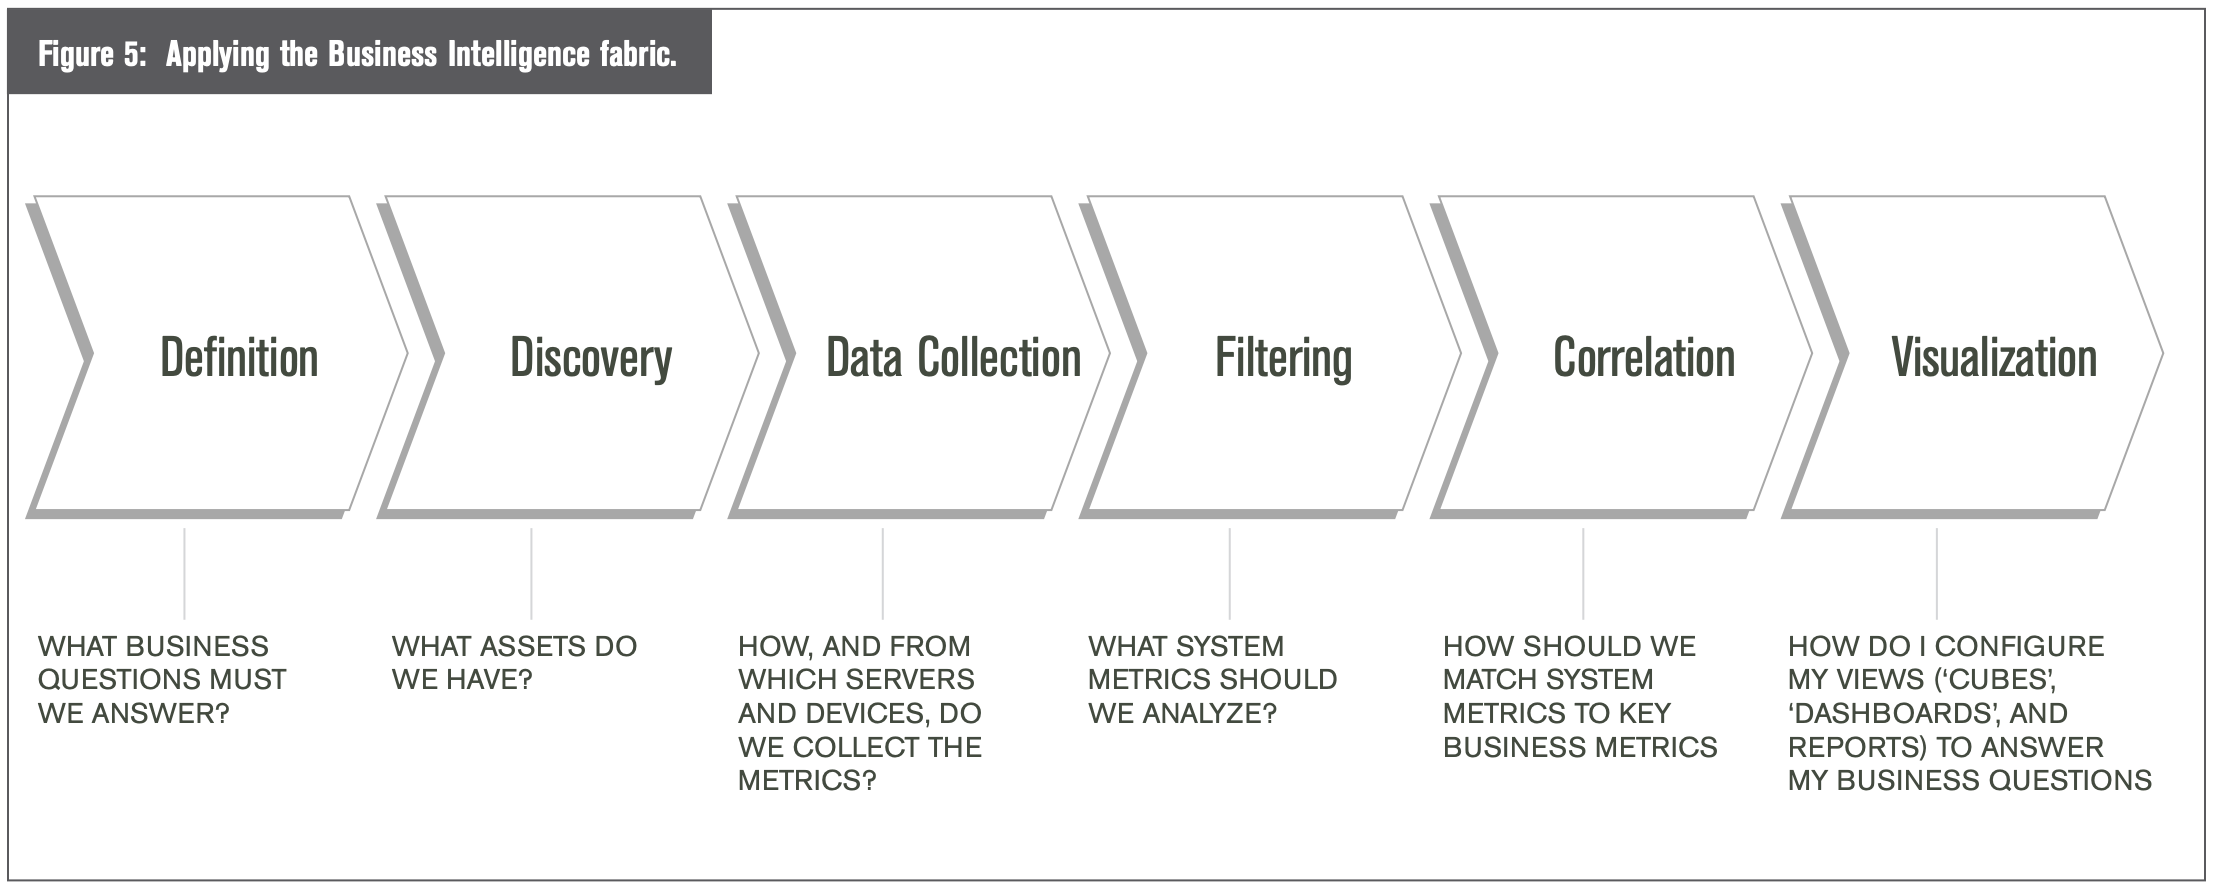
Establishment of an automated asset-identification process is critical to the success of implementing the BI fabric. During this step, we will map out an approach to automate the asset discovery process. We will work with the organization to identify which groups of assets will participate in the IT Analytics project. For each asset group, we will install our software using the organization’s chosen automated software distribution tools, after which the installed software will automatically discover server and device assets and their associated configurations and capabilities.
Next, we will need to establish an automated means for gathering system and business measures: identify the key metrics that need to be gathered, the frequency of their collection, and the collection order, so the organization can initiate the data collection process.
The data collected in the data collection step is often raw. Consequently, it is common to cleanse the collected data. As part of this step, the organization must also be able to identify and filter the gathered data that is required to address the identified business questions.
This is where the business metrics identified by the organization are linked with the collected data and events. Once collected, the data is merged with related business data required to match the system metrics to business processes. For example, if the objective were to correlate trading volume to CPU utilization, then tasks would be required to gather trading volume data and time- align it to CPU metrics.
Being able to visualize the results of correlated data is essential for decision makers. In this step, the consolidated metrics are prepared for visualization using OLAP “cubes” or dashboards. Depending on the business questions posed, a series of views are created to represent historical and real-time system and business metrics.
Business intelligence is never manufactured from a single piece of data or a particular event. Instead, BI is a composite image made from several disparate data pieces and events that, when taken as a whole, create intelligence. Think of an image displayed on a computer screen. The image manifests only by the synchronized effort of hundreds of pixels, each representing a single piece of data. Although the pixel is critical to create the overall image, it is the image itself that affords value.
The most difficult challenge in delivering BI is to create, reliably and on-demand, this amalgamation and correlation of data and events in order to produce a BI image that fulfills a specific business need. This difficulty comes mainly from the fact that traditional technology and techniques used in BI efforts are focused on a particular task, such as ETL or OLAP. These warehouse-centric technologies are simply not designed to reach across the enterprise and — in real-time – monitor, collect, and analyze an array of data and events, creating the BI necessary to facilitate better decision-making.
However, just because warehouse-centric technology cannot fill the BI gap does not mean that no technology exists to do so. There are mature applications born in the IT management arena that have a proven record of monitoring and collecting highly disparate data and events from complex networks, systems, and applications. Moreover, of these IT management applications, the best-of- breed can create, on-demand and in real-time, composite and correlated views that facilitate better decision making. These are the techniques and technologies that must be drafted into a larger role in our enterprises. These are the technologies that can fill the BI gap.
Appendix A
The technical architecture is one of the fundamental layers to the BI fabric. As shown in Figure A, architectural components in this layer include network connectivity and hardware systems implemented throughout the enterprise. This architecture is critical to the well-being of the organization. Company operations can come to a stand-still if any component fails or experiences performance degradation.
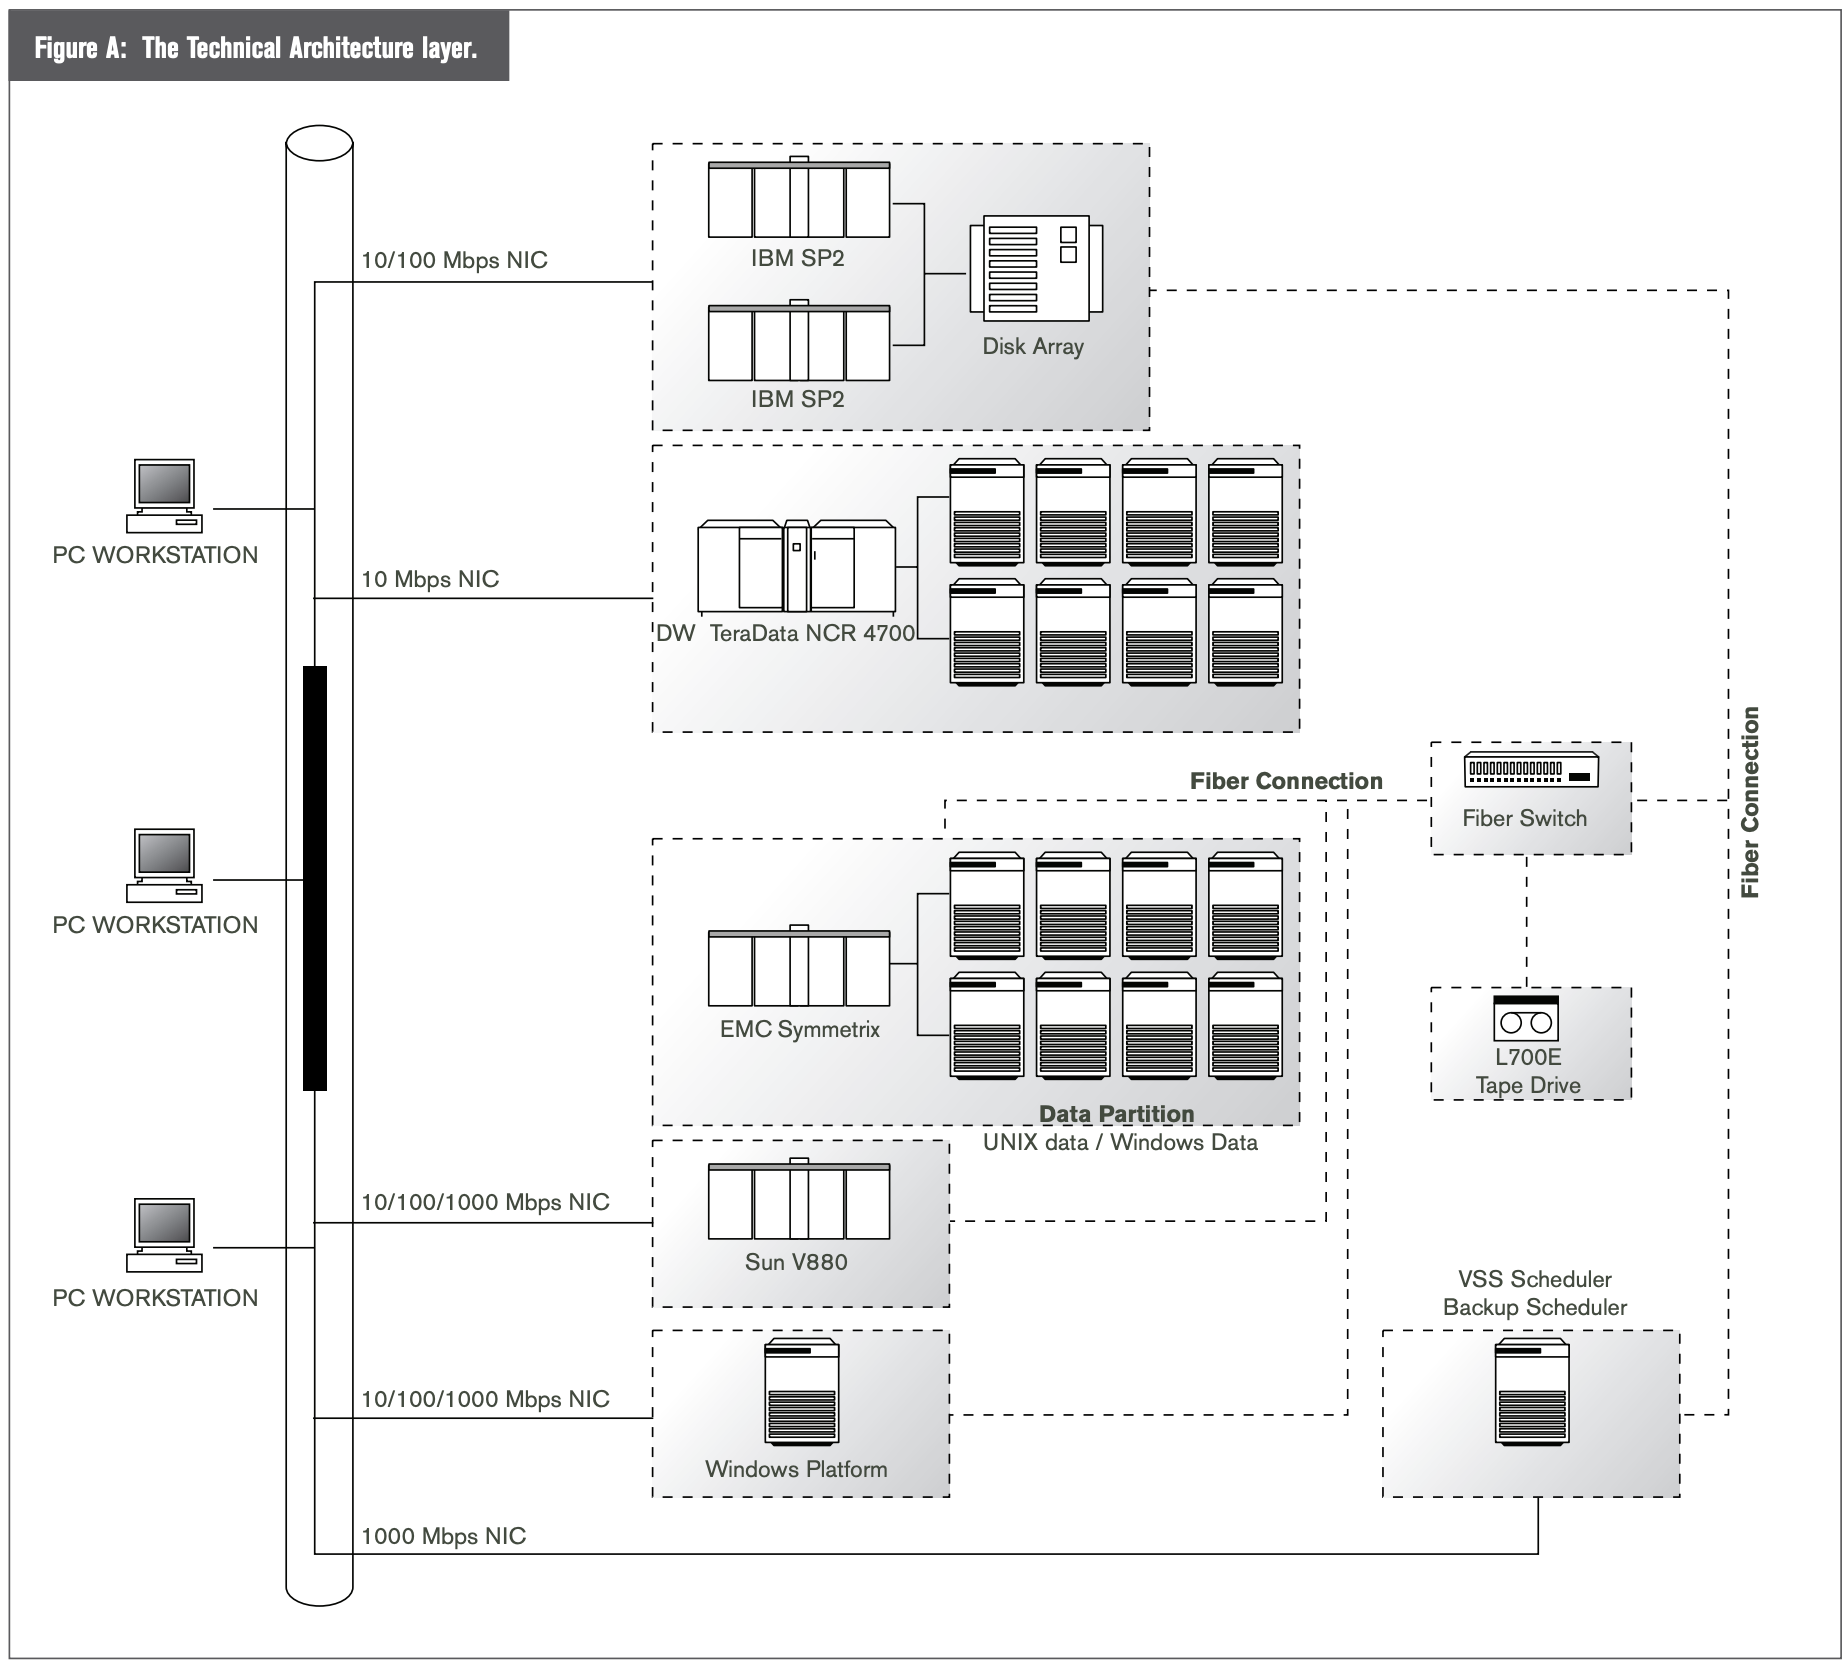
However, if the technical architecture is treated as merely a necessary aspect of day-to-day operations, then an organization will miss the incredible value this layer brings to a BI effort. This value lies not only in the delivery of critical data on a timely basis to BI applications, but also resonates in the informational content contained within the architecture itself.
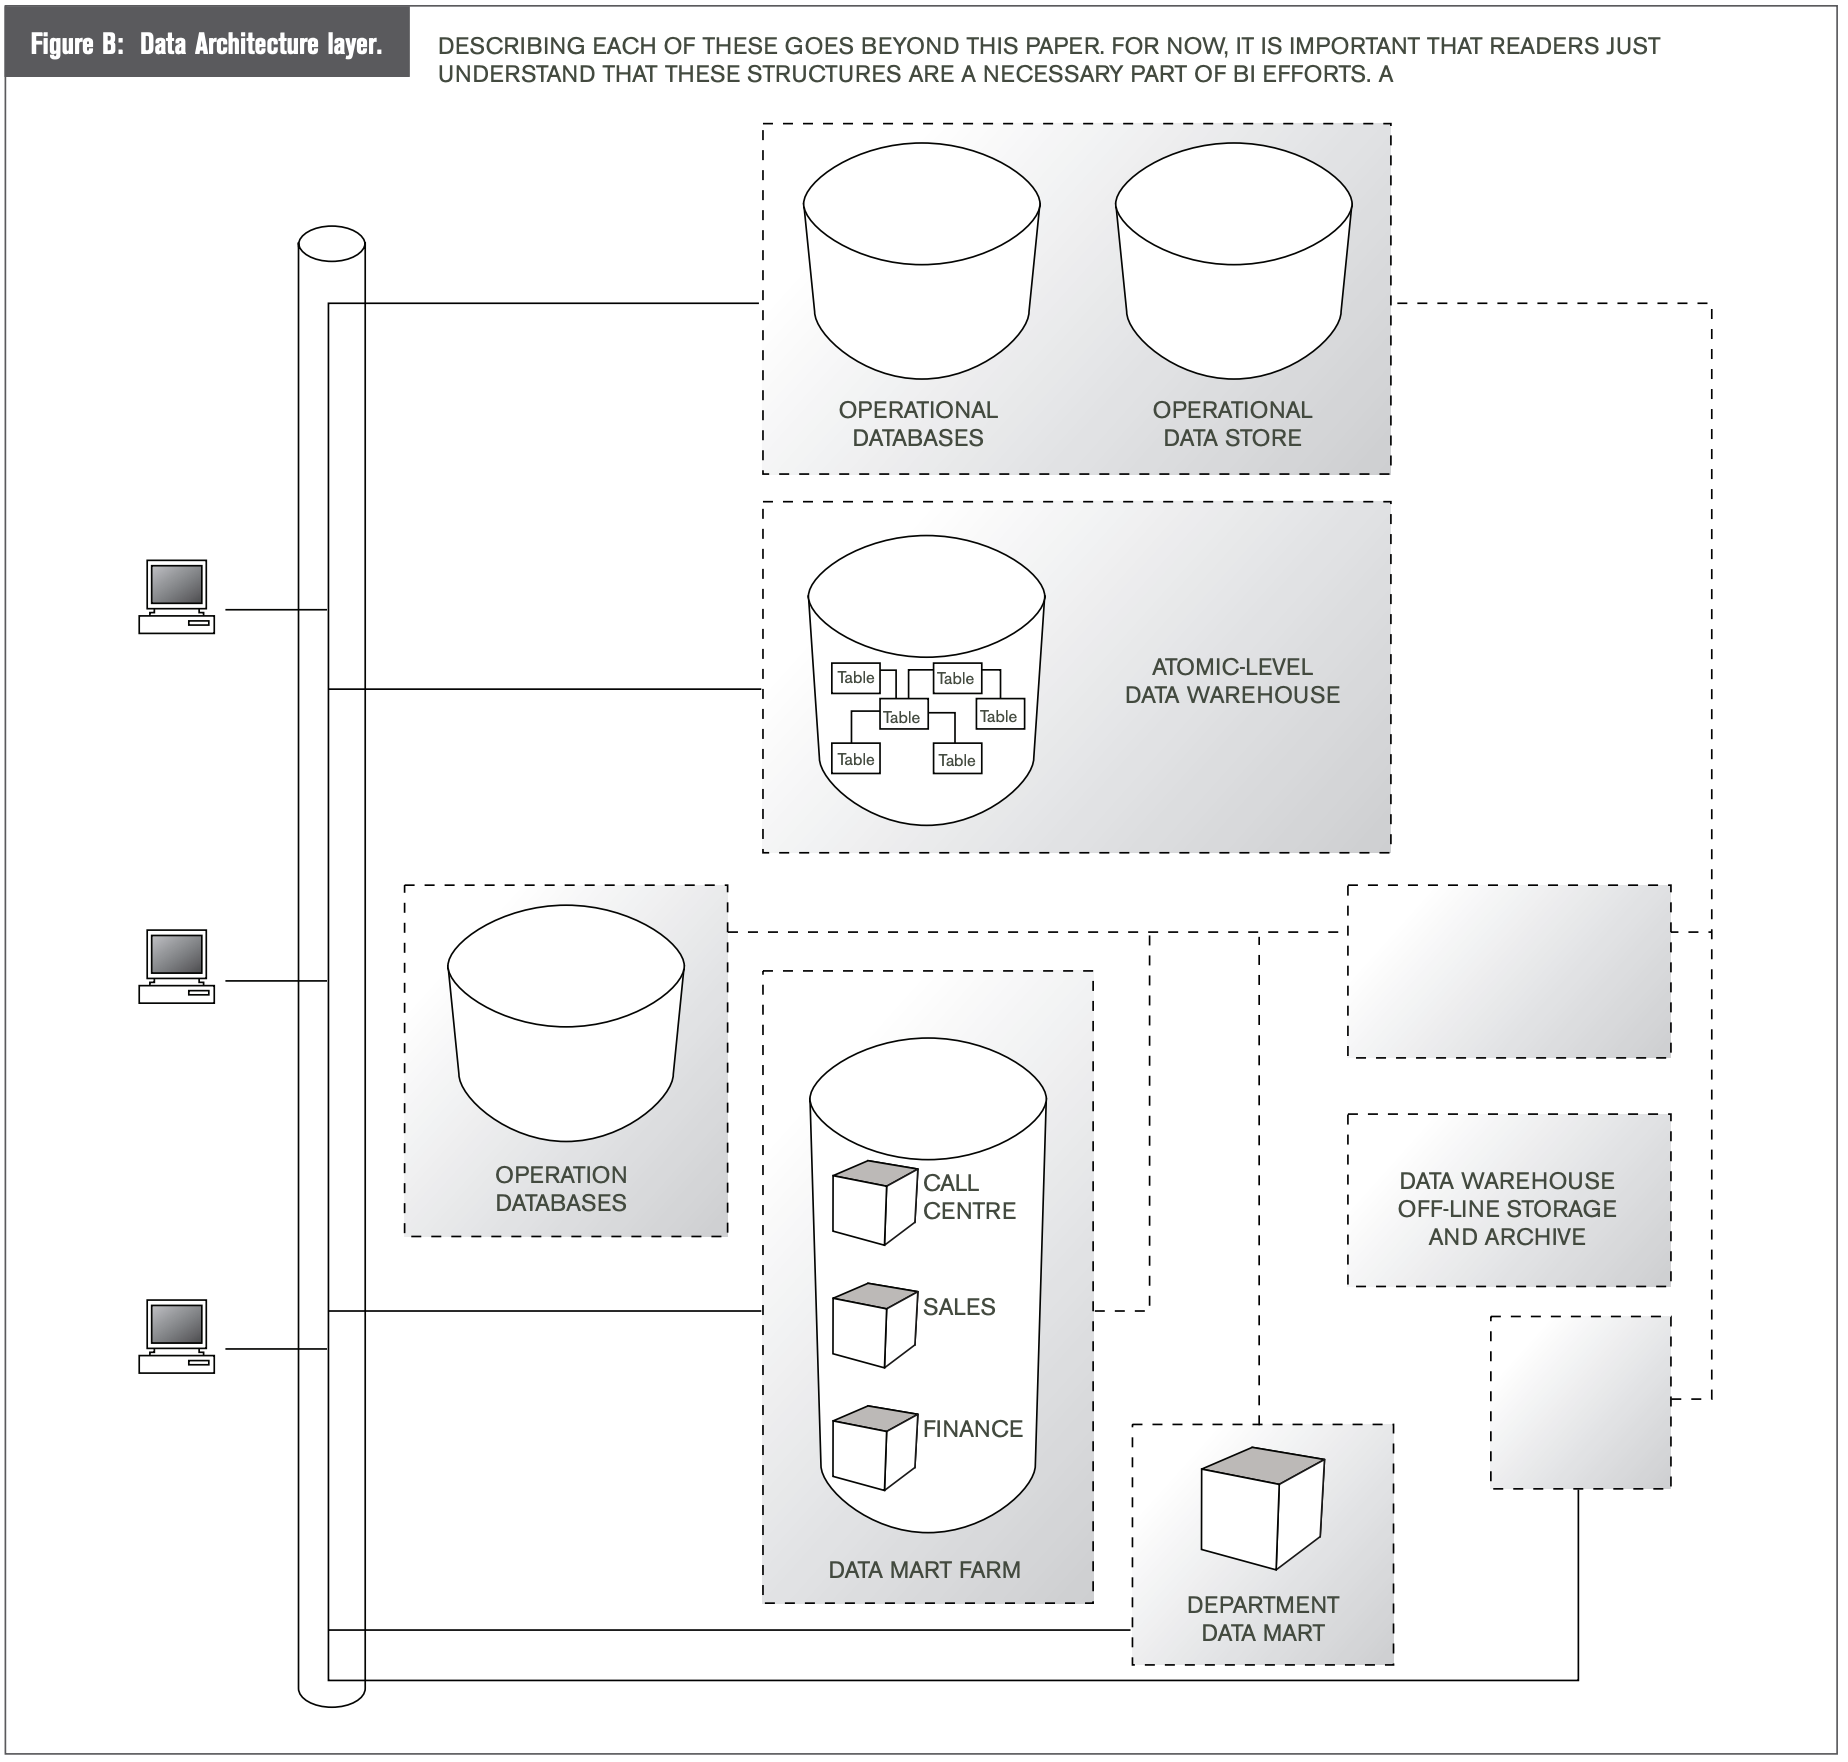
The data architecture layer serves as the basis for much of the detail design of warehouse iterations. Architects define the type of persistent data structures necessary to address business requirements. Common structures include the atomic-level data warehouse, data marts (either star schemas or cubes), and operational data stores (ODS).
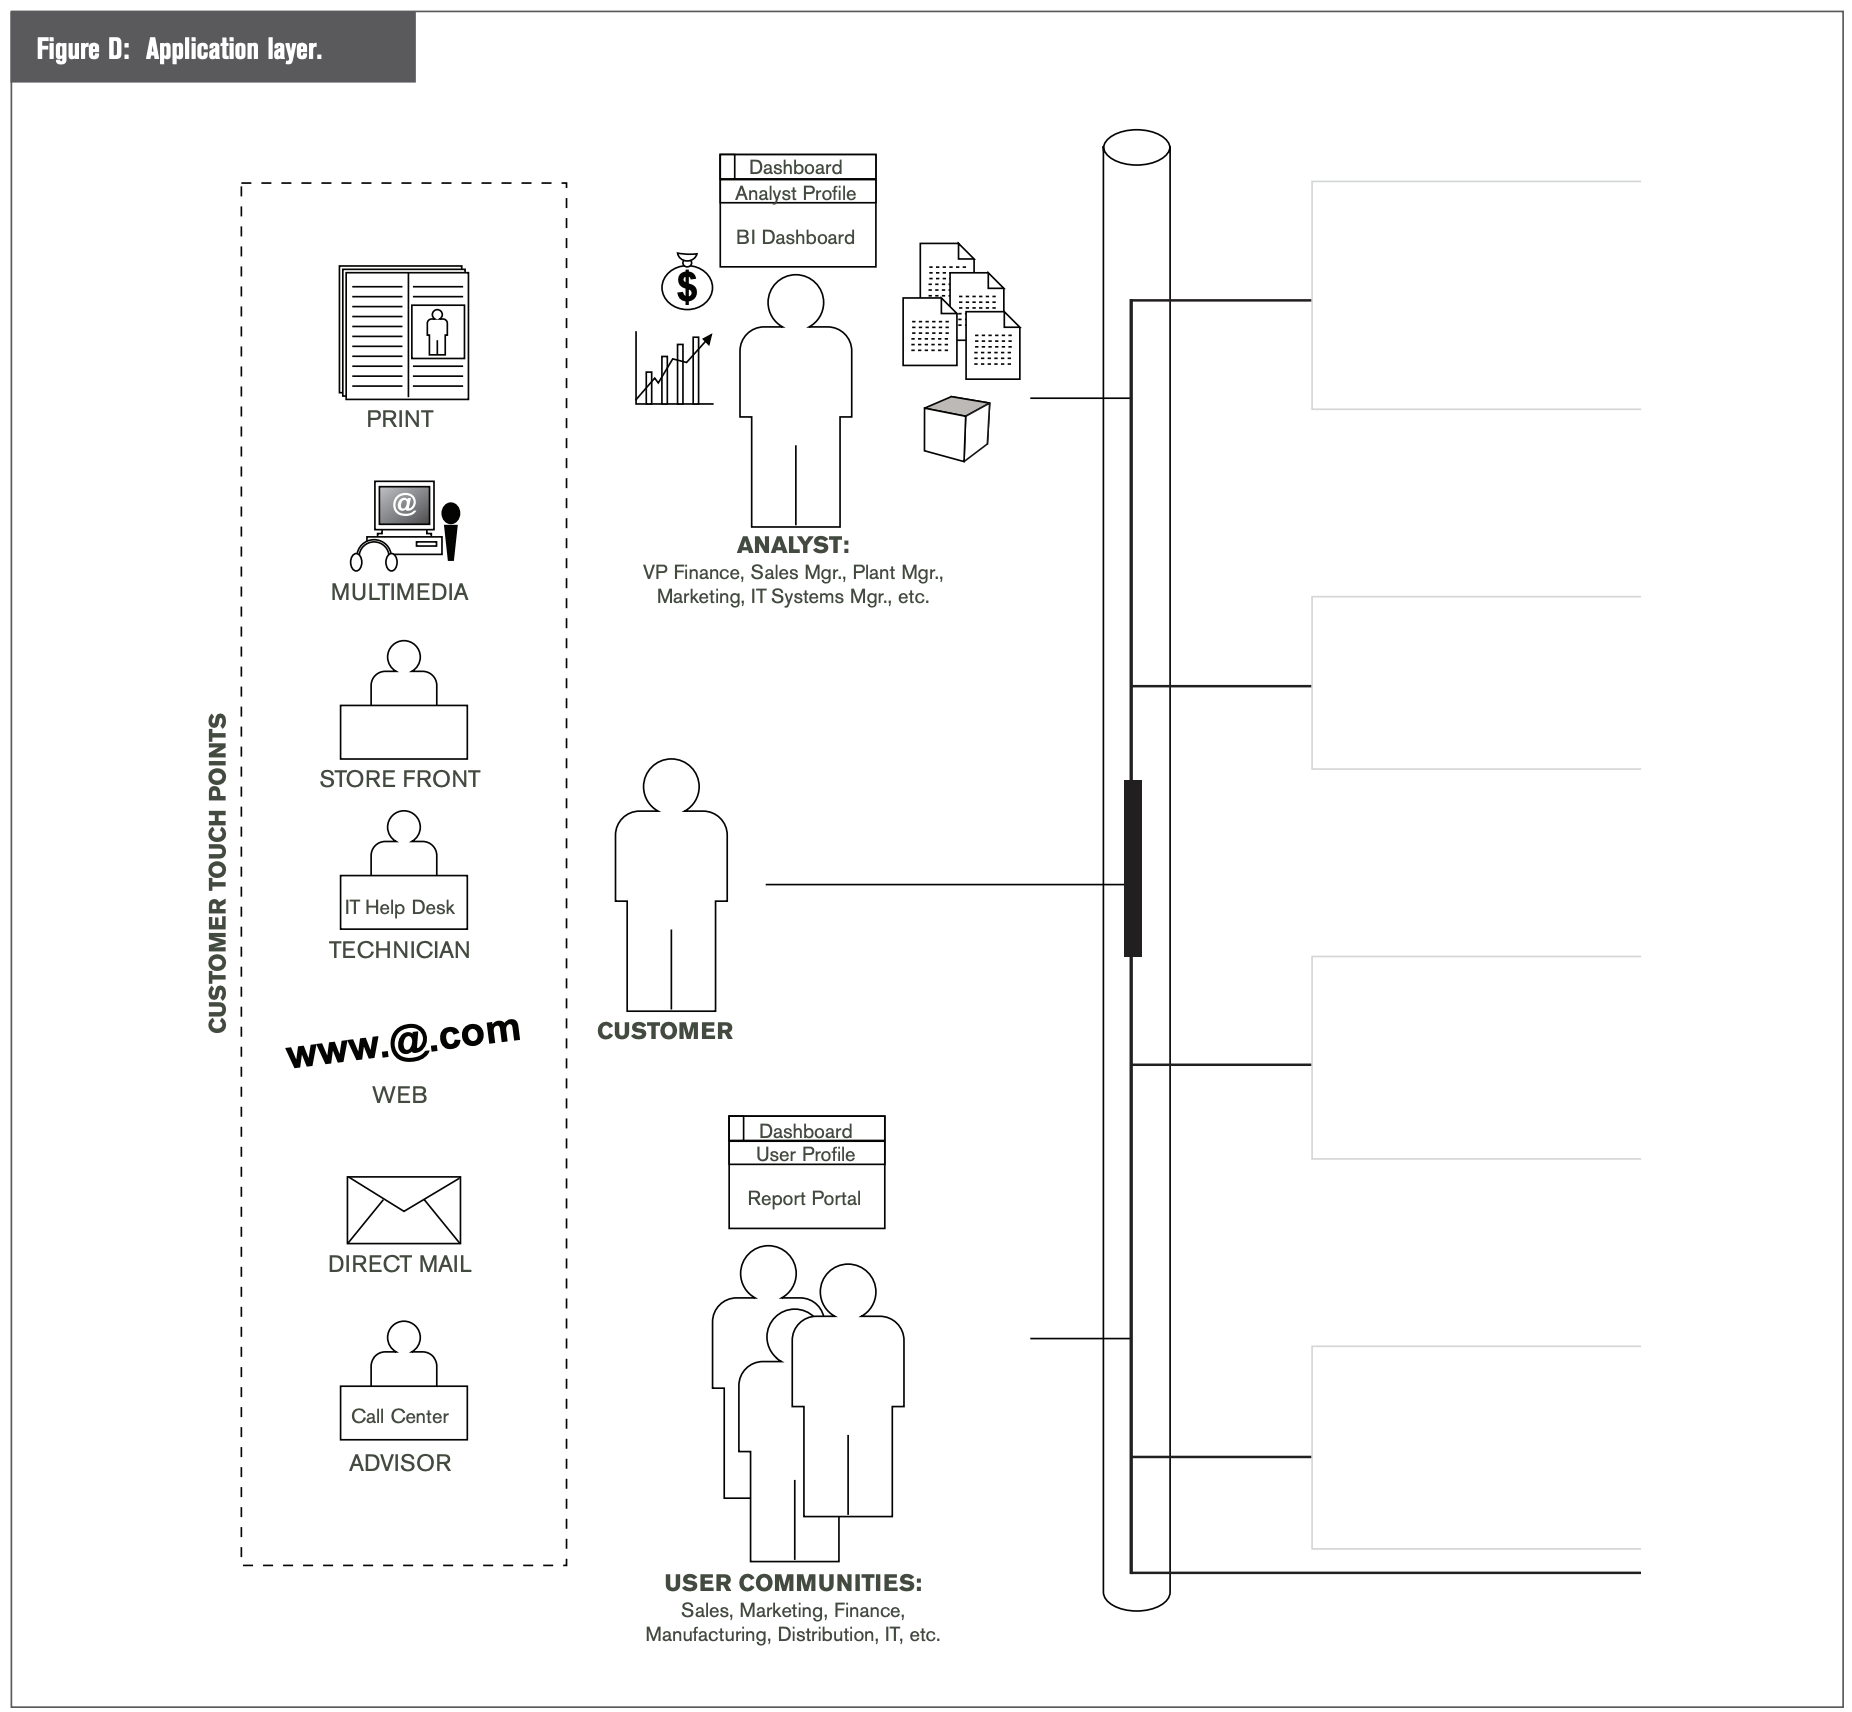
The touch point layer contains the touch points we have identified in our enterprise-wide environment. Touch points include internal applications for analysts and companies’ user communities, which are mainly reporting and analysis applications. Customers have several touch points. These can be call centers, ATM machines, cash registers, and banner ads, for example. See Figure D.
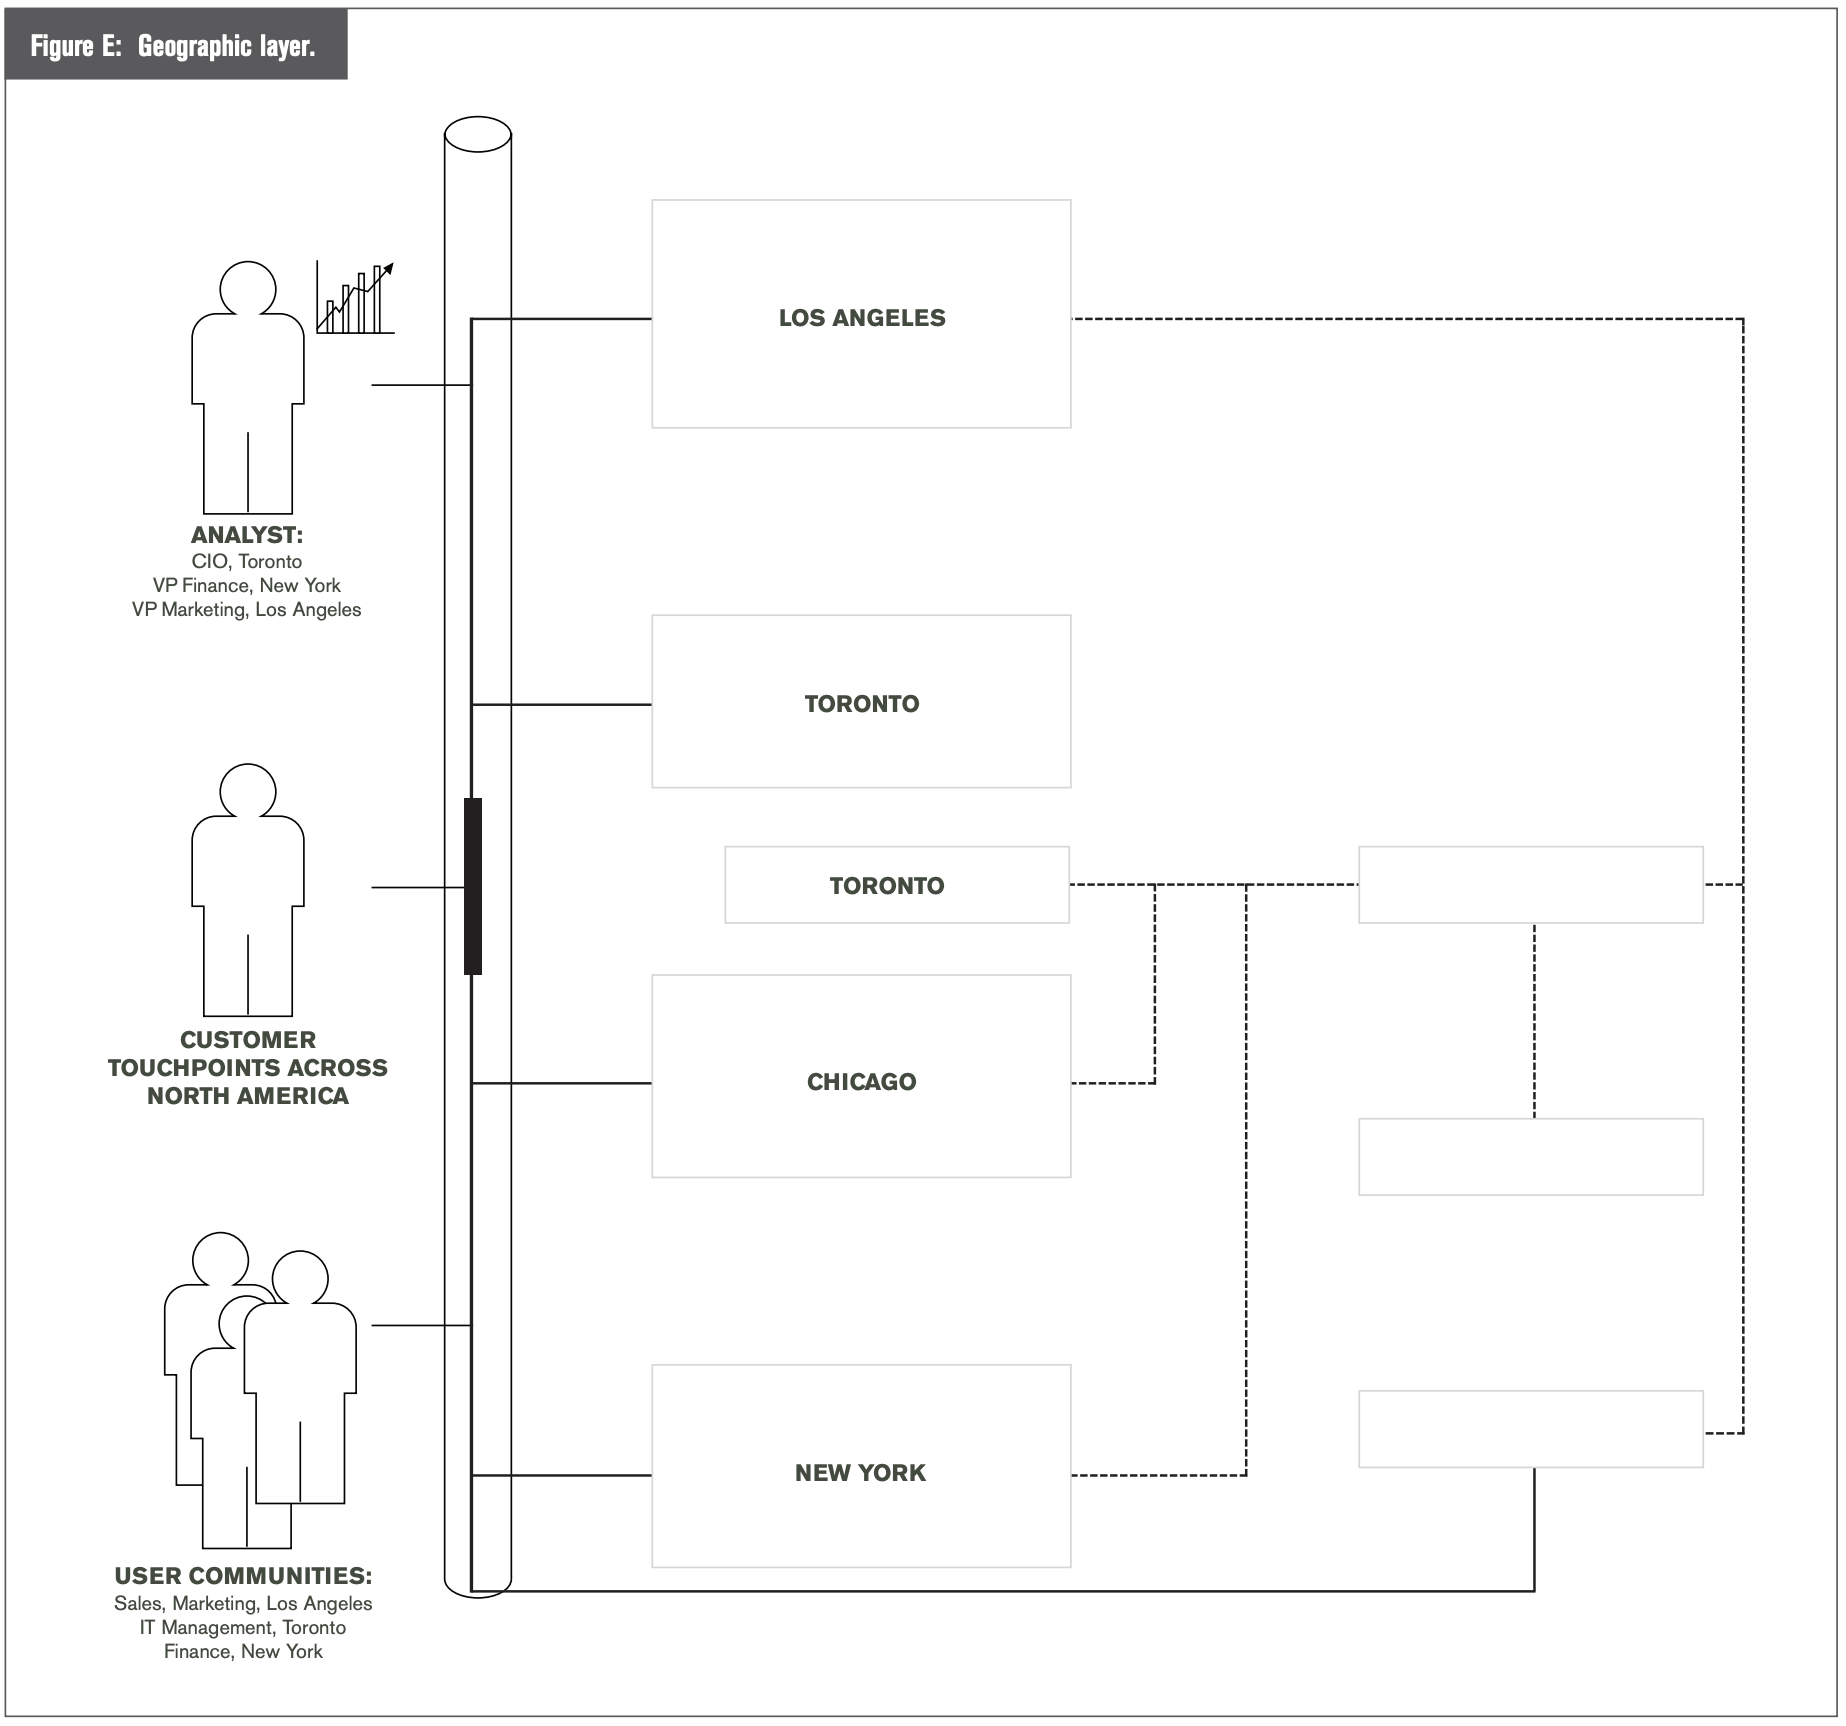
Finally, a layer often overlooked is the one containing the geographical location of all the systems and applications of our enterprise. Many global corporations must consciously address the issues born from wide-flung companies and departments. See Figure E.
…Platform Computing delivers intelligent, practical enterprise grid software and services that help organizations plan, build, run and manage grids by optimizing IT resources. Through our proven process and methodology, we link IT to core business objectives, and help our customers improve service levels, reduce costs and enhance business performance. With industry- leading partnerships and a strong commitment to standards, we are at the forefront of grid software development, propelling over 1,600 clients toward powerful insights that create real, tangible business value. For more information.


